Don't explain it. Draw it.
Describing a layout to an AI in words gets long fast, and it still leaves gaps. A rough sketch shows sizes, order and what's connected at a glance. A fictional dashboard shows how to send one, what to check and when words still win.
Watch the reel
Last week we wrote about talking to your AI instead of typing: said out loud, a request tends to carry the context the AI would otherwise have to guess.
Drawing works the same way. When what you want has a shape (a page, a screen, a process, a room), a quick sketch on paper can say in one photo what takes a paragraph to write. And it often says things you wouldn't think to write at all.
The same dashboard, two ways
Here is the example from the reel. It's fictional. Someone wants a simple sales dashboard and starts describing it in words:
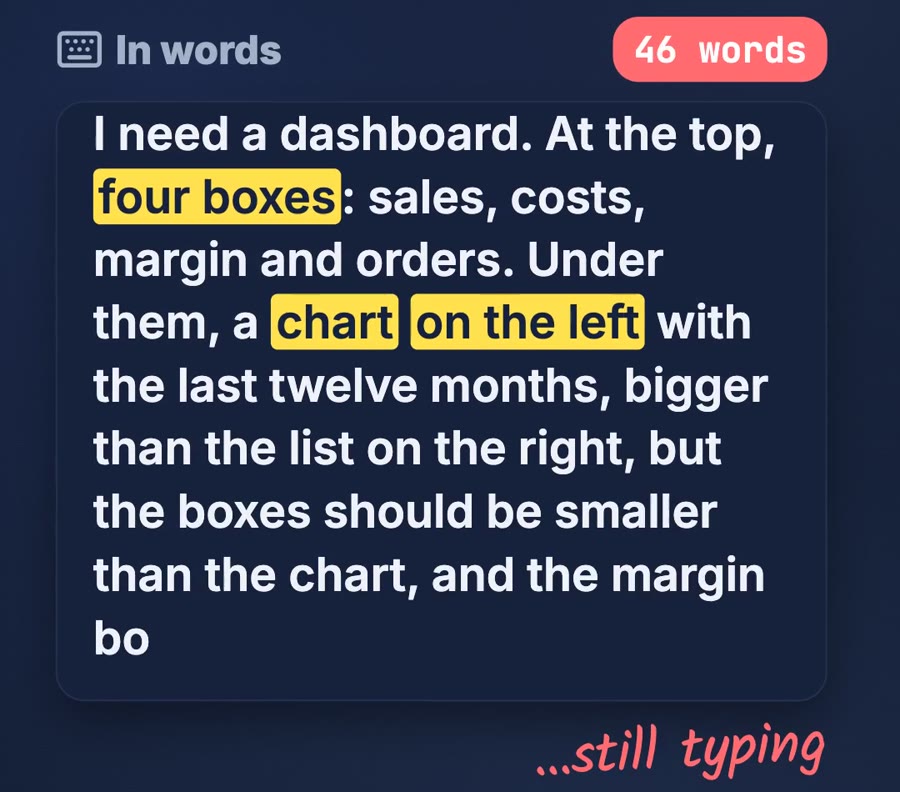
I need a dashboard. At the top, four boxes: sales, costs, margin and orders. Under them, a chart on the left with the last twelve months, bigger than the list on the right, but the boxes should be smaller than the chart, and the margin box should stand out a bit more, maybe in another colour, and the list should line up with…
It's still going. In the reel the word counter passes 40 and the description isn't finished. Every size has to be explained against something else ("bigger than", "smaller than", "line up with"), and the reader has to rebuild the picture in their head.
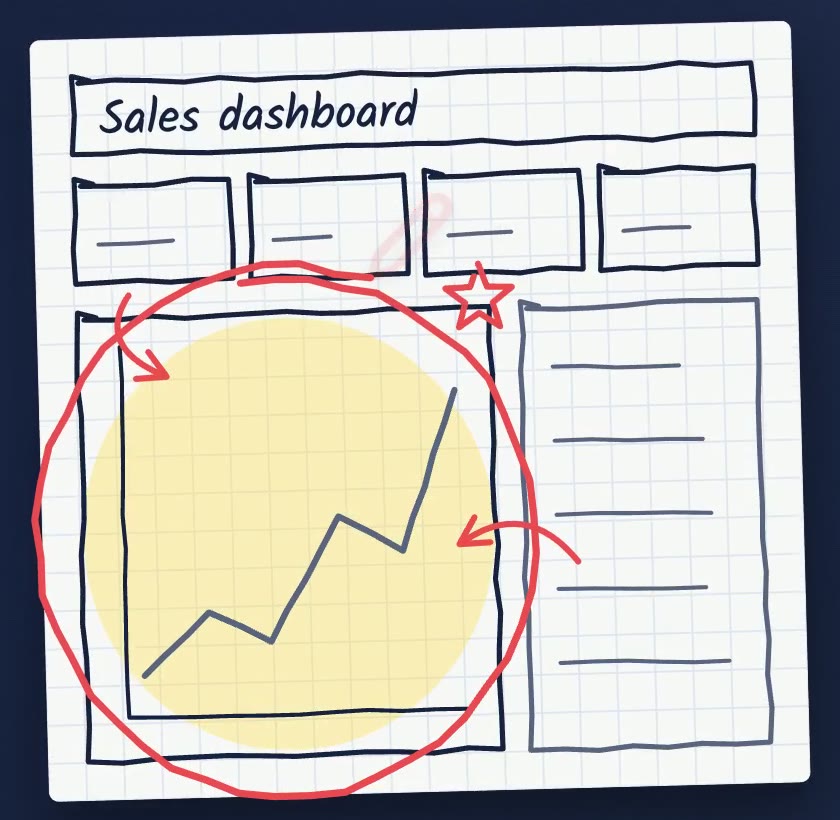
The other way: grab a pen and draw it on any paper. A title bar, four small boxes, a big chart on the left, a list on the right. Then two red arrows and a circle around the part that matters.
What a sketch carries
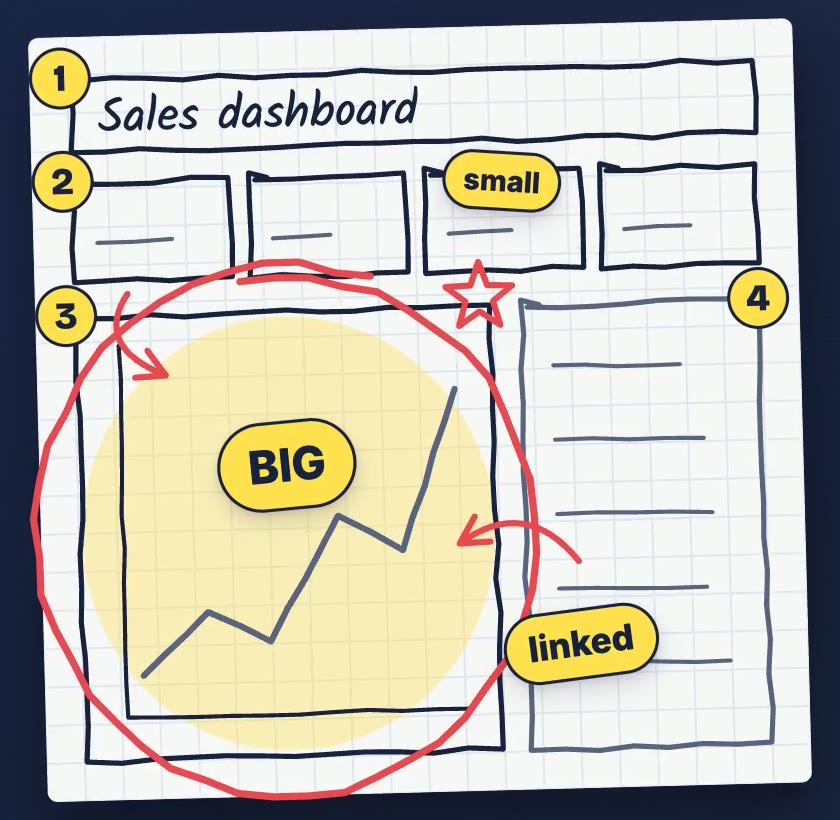
Put the two side by side and the sketch has already answered most of the questions the paragraph was struggling with. These four are the ones the reel marks:
| A sketch shows | In the example | In words, you'd have to write |
|---|---|---|
| Sizes | the chart is big, the four boxes are small | "bigger than…", "smaller than…" for every pair |
| Order | title first, then the boxes, then the chart and the list | which part comes first, second, third |
| What's connected | an arrow from the list to the chart | which parts belong together |
| What matters | a red circle around the chart | which part you care about most |
None of this needs to be neat. A box is a box even if the lines wobble. What counts is that the proportions and positions are roughly right, because that's the information a sketch carries better than text.
How to send it
- Sketch it on any paper. Boxes, arrows, and a circle around what matters. A pen that writes clearly helps more than a ruler.
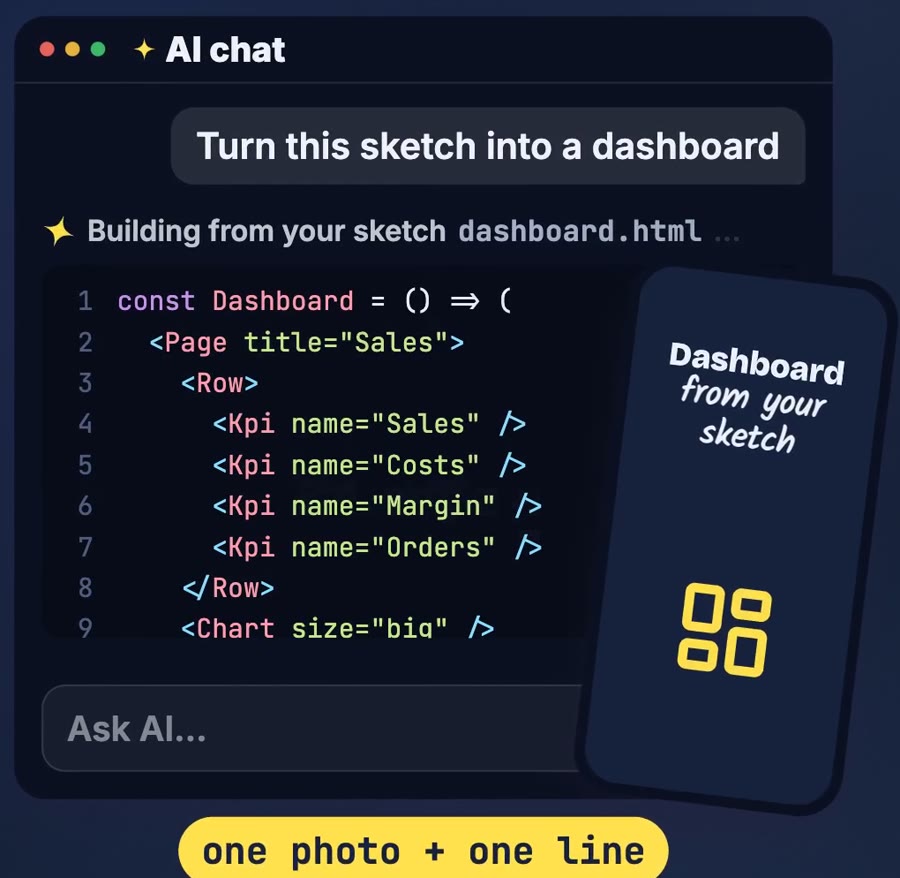
- Snap a photo and attach it to the chat. In Claude you upload it like any file, or drag it into the chat window; other AI chat apps have a similar attach button.
- Add one line: what you want built from it. In the reel it's "Turn this sketch into a dashboard". The photo shows the layout; the line says what to do with it.
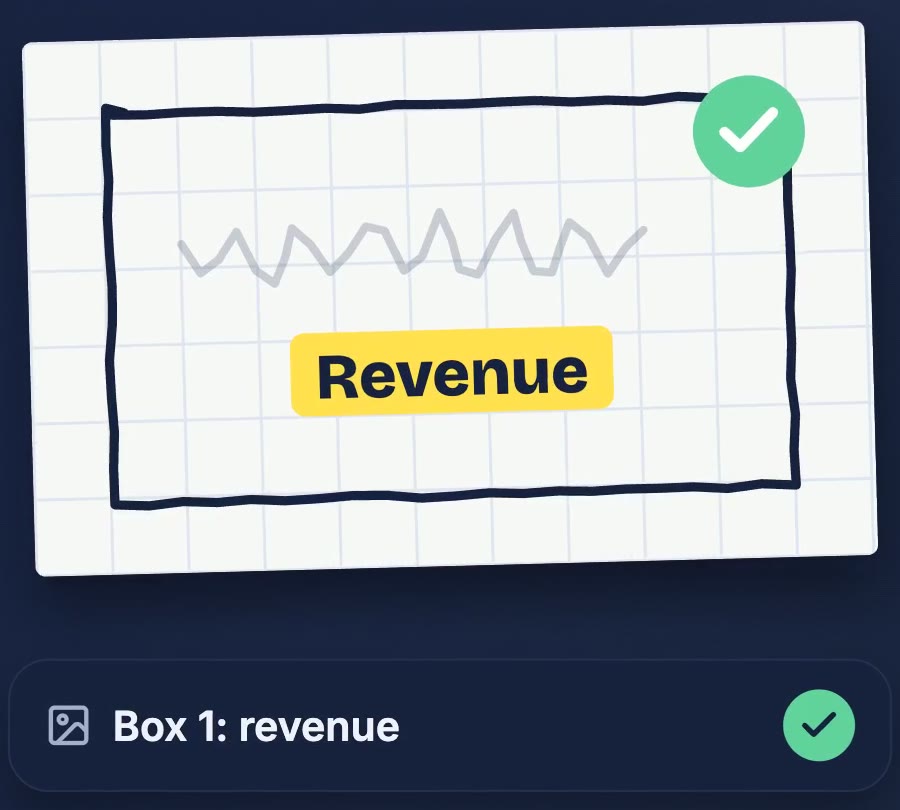
- Type what's hard to read. If a label is a scribble, write it in the message: "Box 1: revenue". Handwriting is where a photo is most likely to be misread.
What to check
A sketch saves typing, but the AI still has to read it, and it can read it wrong. Anthropic's own guide to images says Claude "might hallucinate or make mistakes" with images that are low-quality, rotated or very small, and asks you to review what it understood. Three habits help:
- Before you send: good light, the page straight, the whole sketch in the frame. Crop out the rest of the desk so there's only one thing to read.
- Before it builds: for anything bigger than a quick test, ask it to describe the sketch back first: the parts it sees, their order and sizes, and the labels. A misread label is cheap to fix at this point.
- After it builds: put the result next to your sketch. Is the big thing big? Is the circled part the one that stands out? If not, say what's off, or mark it on the sketch and send a new photo.
When words are better
A sketch shines when the request is about layout: where things go, how big they are, what connects to what. It's the wrong tool when:
- The exact text matters: a name, an amount, a date, a sentence that has to be word for word. Type it.
- It's a quick question: if one line explains it, one line is faster than drawing.
- The thing already exists: if the page or screen is already there, a screenshot is better than redrawing it. Mark it up the same way, with arrows and a circle.
- Precision matters: if every size has to be exact, write the numbers. A sketch gives proportions, not measurements.
And it doesn't need to be pretty. Just clear. The same trick works for a page, a process, a room… a plan.
Try it once
Next time you catch yourself writing a long description of how something should look, stop and draw it instead. Sketch it, snap a photo, add one line about what you want built, and type any label that's hard to read. Then compare the result with what you usually get from the paragraph.
What would you sketch first?
Sources
- Anthropic: Vision (consulted 17 November 2026). How to send an image in claude.ai, and the "Limitations" section quoted under "What to check" (mistakes with low-quality, rotated or very small images, and the advice to review Claude's image interpretations).
The dashboard, the typed description and the chat are fictional. No AI answer is shown: the reply and the code on screen in the reel are an illustration, not a recording of a live session. "Sizes, order and what's connected" is our own way of describing what a sketch carries, not an official list. AI voice generated with Kokoro. Music: “Reaching Out” by Michael Ramir C. (Mixkit).